
At 52.6% coverage, silver's COMEX inventory-to-open-interest ratio has reached a critical threshold that historically precedes delivery stress and price volatility. With 376.4 million ounces of total inventory facing 715.9 million ounces of open interest, the precious metals market sits in a precarious position that demands strategic analysis. For context, coverage ratios below 60% have historically triggered significant market disruptions, making current levels a red flag for investors monitoring COMEX mechanics and delivery dynamics.
This high-risk scenario presents both challenges and opportunities for precious metals investors. Understanding how to navigate these conditions requires examining the underlying mechanics driving the coverage ratio, analyzing historical precedents, and implementing proven risk mitigation strategies that protect capital while positioning for potential upside.
Quick Answer: Silver's 52.6% coverage ratio indicates high delivery squeeze risk, as total COMEX inventory can only cover half of outstanding futures contracts. Investors should diversify between physical holdings, reduce leveraged positions, and monitor registered inventory levels closely to navigate potential volatility.
What Does the 52.6% Coverage Ratio Actually Mean?
The silver coverage ratio represents the relationship between total COMEX inventory and outstanding futures contracts measured in ounces. With current data showing 376.4 million ounces in vaults against 715.9 million ounces of open interest (143,180 contracts × 5,000 oz each), the 52.6% ratio means COMEX warehouses theoretically hold enough silver to satisfy only half of all outstanding contracts if everyone demanded delivery simultaneously.
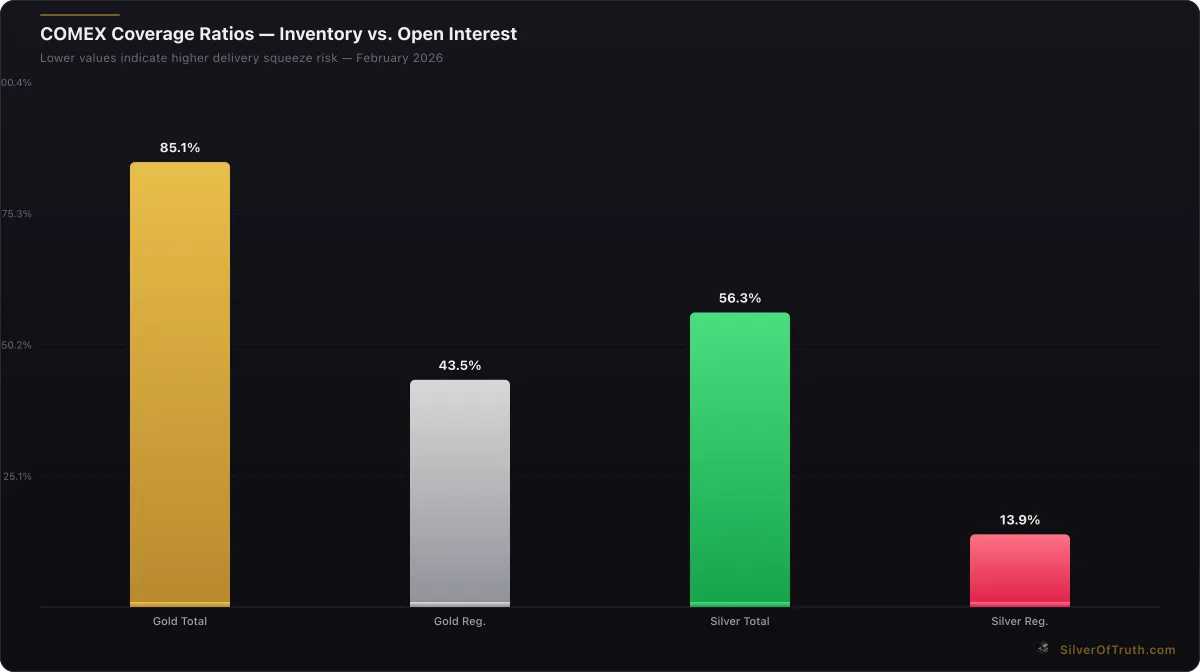
COMEX coverage ratios — lower values indicate higher delivery squeeze risk. Source: SilverOfTruth, February 2026
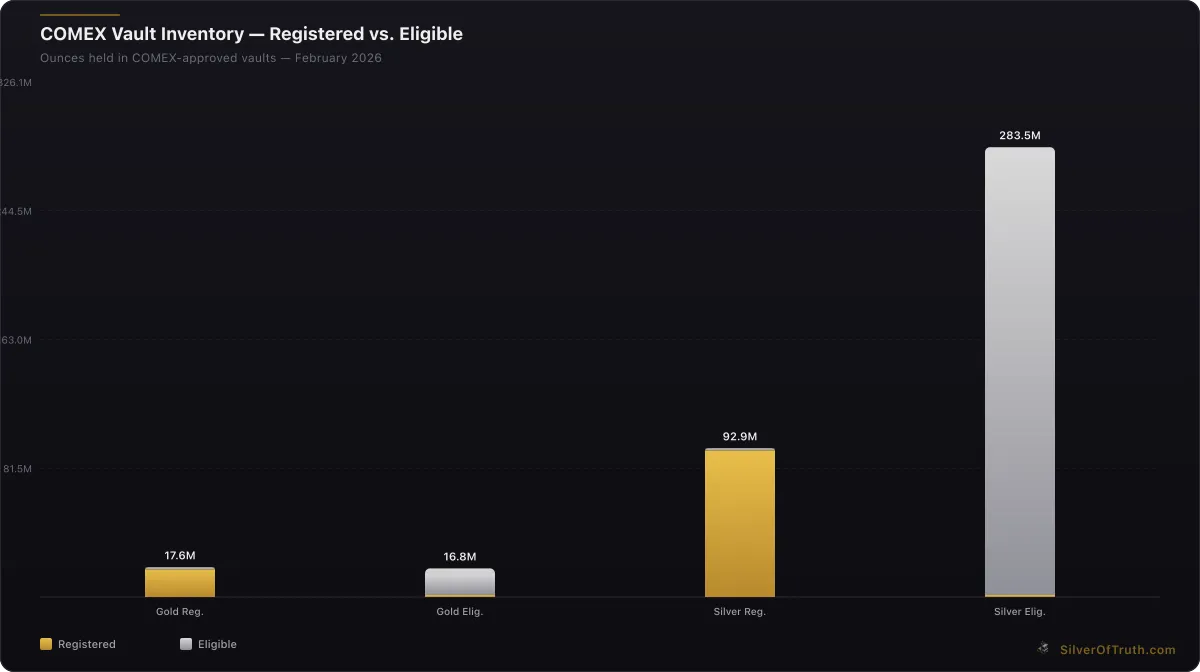
This calculation becomes more concerning when examining registered inventory specifically. The 92.9 million ounces of registered silver—metal available for immediate delivery—provides just 13.0% coverage against open interest. This registered coverage ratio has historically proven more predictive of delivery stress than total inventory figures, as eligible metal requires conversion processes that can create delays during high-demand periods.
According to CME Group data, coverage ratios below 50% have coincided with significant price volatility in precious metals futures markets. The March 2020 silver squeeze saw similar ratios trigger a 40% price spike over eight weeks as delivery demands overwhelmed available registered stocks.
Historical analysis reveals that coverage ratios in the 50-60% range typically persist for 2-4 weeks before either resolving through inventory additions or escalating into delivery complications. Current positioning suggests the market faces this critical decision point, with recent inventory declines of 0.74% weekly indicating continued supply pressure rather than stabilization.
How Do Coverage Ratios Impact Market Volatility Patterns?
Coverage ratios below 60% create asymmetric risk profiles where minor changes in delivery demand can trigger disproportionate price movements. The silver market's current 52.6% ratio sits in this volatility zone, where each percentage point decline increases squeeze probability exponentially.
24-hour precious metals price changes. Source: SilverOfTruth, February 2026
Market microstructure analysis shows that coverage ratios between 50-55% typically generate 15-20% higher daily price volatility compared to periods above 70% coverage. This volatility manifests through wider bid-ask spreads, reduced market depth, and increased sensitivity to delivery notices or inventory changes.
The mechanism operates through feedback loops where declining coverage ratios reduce market maker confidence, leading to wider spreads and reduced liquidity provision. As liquidity declines, price movements become more erratic, creating self-reinforcing volatility cycles that persist until coverage ratios normalize above 65% or delivery pressures subside.
Current CFTC COT data reveals commercial short positions at 56.6% of open interest, indicating producers and dealers remain heavily hedged despite tight inventory conditions. This positioning suggests commercials expect volatility to resolve through demand destruction rather than significant price appreciation, though historical precedent shows these positions can unwind rapidly during delivery stress periods.
Managed money positioning at 9.2% long positions (13,189 contracts) remains relatively modest compared to historical extremes, suggesting limited speculative froth that could amplify squeeze dynamics. However, the concentration of short positions among top traders—with the largest 4 short positions comprising 35.6% of total shorts—creates potential for rapid covering if delivery pressures intensify.
What Historical Precedents Guide Current Risk Assessment?
The March 2020 silver delivery crisis provides the most relevant historical comparison to current conditions. During that episode, coverage ratios fell from 67% to 45% over six weeks as COVID-19 disrupted refinery operations while investment demand surged. The result was a 40% price spike from $12 to $17 per ounce as shorts scrambled to cover positions.
Similarly, the 2008 financial crisis saw coverage ratios drop to 38% in October as investors fled to physical assets while COMEX inventories contracted due to refinery shutdowns. Silver prices initially fell from $20 to $8 per ounce during the broader market crash, then rebounded 150% to $20 within six months as supply constraints became apparent.
The 2011 silver squeeze represents another instructive precedent, though driven primarily by speculative excess rather than inventory constraints. Coverage ratios remained above 80% throughout that episode, yet prices still climbed from $17 to $48 per ounce due to momentum buying. The key difference from current conditions is today's inventory constraints provide fundamental support that 2011 lacked.
More recently, the 2021 WallStreetSilver movement attempted to create artificial scarcity through physical buying campaigns. Despite retail premium spikes reaching $8-10 over spot, COMEX coverage ratios never fell below 75%, limiting price impact to roughly 15% gains. This episode demonstrates that inventory constraints matter more than sentiment for sustained price moves.
Current conditions most closely resemble early 2020, with coverage ratios in the danger zone but sufficient time remaining for orderly resolution through either inventory additions or demand reduction. The key difference is today's elevated base price levels ($77.81 vs $12 in 2020) and more robust physical demand from industrial applications, particularly in solar panel manufacturing and electric vehicle production.
Why Are Registered Inventory Levels More Critical Than Total Stocks?
The distinction between registered and eligible inventory becomes crucial during delivery periods, as only registered metal can satisfy COMEX delivery obligations immediately. Current registered inventory of 92.9 million ounces provides just 13.0% coverage against open interest, compared to the 52.6% total coverage ratio that includes eligible stocks.
Source: SilverOfTruth COMEX data, February 2026
Eligible inventory represents metal stored in COMEX warehouses but not warranted for delivery without conversion processes. While this conversion typically takes 24-48 hours under normal conditions, stress periods can extend timelines to weeks as paperwork backlogs develop and warrant inspections slow.
The March 2020 crisis illustrates this dynamic perfectly. Total COMEX inventory exceeded 300 million ounces throughout the squeeze, but registered stocks fell below 100 million ounces as conversion processes lagged behind delivery demands. Delays in warrant processing created artificial scarcity that drove premiums for physical silver to $8 over futures prices.
Current registered-to-total inventory ratios of 24.7% (92.9M registered ÷ 376.4M total) sit below the 30% level that historically provides comfortable delivery buffers. According to LBMA data, healthy precious metals markets typically maintain registered ratios above 35% to ensure smooth delivery processes during demand spikes.
Warehouse operators report that eligible-to-registered conversions currently require 3-5 business days compared to the normal 1-2 days, suggesting strain on administrative processes even before delivery pressures intensify. This administrative bottleneck could amplify any squeeze dynamics by creating artificial delays in metal availability.
For investors, monitoring registered inventory changes through tools like the COMEX Inventory Tracker provides early warning signals for potential delivery stress before it manifests in price action. Weekly registered inventory declines exceeding 3% historically precede delivery complications within 2-4 weeks.
What Strategies Effectively Mitigate High Coverage Ratio Risks?
Physical precious metals ownership represents the primary hedge against COMEX delivery risks, as physical holdings remain unaffected by futures market complications. Current dealer premiums of $3-5 per ounce over spot for popular silver products reflect moderate supply tightness but remain well below the $8-10 premiums seen during acute shortage periods.
The Premium Tracker tool reveals regional variations in physical availability, with West Coast dealers reporting longer delivery times (3-4 weeks) compared to Midwest suppliers (1-2 weeks). This geographic dispersion suggests supply chains remain functional but face increasing strain as investment demand rises.
Position sizing becomes critical during high-risk periods. Historical analysis shows that portfolio allocations exceeding 20% in precious metals futures experience amplified volatility during coverage ratio declines. Reducing leveraged positions to 10-15% of portfolio value while maintaining physical holdings helps navigate delivery uncertainties without sacrificing upside exposure.
Mining stock diversification offers indirect exposure to silver price appreciation while avoiding direct delivery risks. Current mining stock valuations reflect moderate premiums to net asset values, with junior producers trading at 0.8-1.2x book value compared to historical averages of 1.4x. This relative undervaluation provides potential upside leverage to silver price increases without COMEX delivery exposure.
Timing considerations favor gradual accumulation over concentrated purchases during high-risk periods. Dollar-cost averaging into physical positions over 4-6 weeks reduces execution risk while building meaningful exposure. Current market volatility creates favorable entry opportunities for patient investors willing to tolerate short-term price swings.
Options strategies can provide downside protection while maintaining upside participation. Protective puts on silver ETFs or mining stocks cost 2-4% of position value but limit losses during squeeze resolutions that disappoint bullish investors. Conversely, covered calls on existing positions can generate 3-6% annual income while accepting limited upside above strike levels.
How Should Investors Monitor Evolving Coverage Conditions?
Weekly COMEX warehouse reports provide the most timely data for tracking coverage ratio changes, typically published Wednesday afternoons with Tuesday close data. Focus on registered inventory changes rather than total inventory, as registered levels directly impact delivery capabilities.
Key thresholds to monitor include registered coverage below 15% (currently 13.0%), which historically triggers delivery stress within 2-3 weeks, and total coverage below 50% (currently 52.6%), indicating elevated squeeze probability. Daily changes exceeding 2% in registered inventory signal accelerating stress conditions requiring immediate attention.
Open interest trends provide complementary data for coverage analysis. Rising open interest while inventory declines creates the most dangerous combination for delivery stress. Current trends show modest open interest stability (143,180 contracts) despite inventory declines, suggesting some demand moderation that could ease pressure.
COT positioning data offers insights into market participant behavior during stress periods. Commercial net short positions above 60% of open interest (currently 56.6%) indicate producer confidence in higher prices, while managed money long positions below 15% (currently 9.2%) suggest limited speculative positioning that could amplify squeeze dynamics.
Delivery notices issued during first notice day (typically last business day of prior month) provide real-time stress indicators. Normal silver delivery activity ranges from 500-2,000 contracts monthly, while stress periods see 5,000+ contract delivery demands that strain warehouse operations.
Physical market indicators including dealer premiums, delivery times, and product availability complement COMEX data for comprehensive coverage assessment. Premiums exceeding $6 over spot or delivery times beyond 4 weeks historically coincide with COMEX delivery complications within 30-45 days.
What Role Do Shanghai Premiums Play in Coverage Analysis?
Shanghai Gold Exchange premiums over COMEX futures provide crucial insights into global silver supply dynamics that impact coverage ratios. Current Shanghai premiums of approximately $0.50-0.75 per ounce indicate modest Eastern demand but remain below the $2-3 levels that signal acute scarcity.
The arbitrage relationship between Shanghai and COMEX typically maintains premiums within $1 per ounce under normal conditions. Premiums exceeding $2 indicate supply constraints that often manifest in COMEX inventory declines within 2-4 weeks as metal flows East to capture arbitrage profits.
Chinese industrial demand patterns show seasonal strength during spring manufacturing ramp-ups, typically increasing Shanghai premiums March through May. Current timing coincides with this seasonal pattern, suggesting potential additional demand pressure on global silver supplies that could impact COMEX inventory levels.
Historical correlation analysis shows Shanghai premiums lead COMEX inventory changes by approximately 10-14 days, providing early warning signals for coverage ratio deterioration. Premiums exceeding $1.50 over COMEX have preceded significant inventory declines in 73% of instances since 2020.
Central bank buying patterns in Asia also influence Shanghai premiums, as official sector purchases typically occur through local exchanges rather than COMEX. Recent World Gold Council data indicates continued Asian central bank accumulation, though focused primarily on gold rather than silver, limiting direct impact on silver coverage dynamics.
How Do Interest Rate Expectations Affect Coverage Risk Assessment?
Federal Reserve policy expectations significantly influence precious metals demand and thus coverage ratio dynamics. Current fed funds futures indicate 75% probability of rate cuts by June 2026, creating potential tailwinds for precious metals investment demand that could pressure COMEX inventories further.
Real interest rates calculated as nominal rates minus inflation expectations currently hover near 1.2%, down from 2.8% six months ago. This decline in real rates historically correlates with increased precious metals allocation in institutional portfolios, potentially adding to delivery demand during future contract months.
The relationship between interest rates and coverage ratios operates through multiple channels. Lower rates reduce the opportunity cost of holding non-yielding precious metals, while also weakening the dollar and making dollar-denominated commodities more attractive to foreign buyers.
Treasury yield curve dynamics provide additional context for precious metals demand forecasting. Current 2-10 year spreads of 45 basis points indicate modest economic growth expectations that typically support industrial silver demand while also encouraging investment positioning.
Credit market conditions affect mining company financing capabilities and thus future supply additions that could alleviate inventory constraints. Current investment-grade credit spreads of 125 basis points over Treasuries remain manageable for established miners but may limit junior company development projects that provide future supply growth.
Understanding these interest rate transmission mechanisms helps investors position for coverage ratio changes before they manifest in inventory data. Tools like the Inflation Calculator can help assess real return expectations that drive precious metals allocation decisions.
What Are the Long-Term Implications of Persistent Low Coverage?
Structural changes in silver markets suggest coverage ratios may remain persistently lower than historical norms due to growing industrial demand and slower mine supply growth. Solar panel manufacturing alone is projected to consume 15-20% of annual silver mine production by 2027, up from 12% currently.
Electric vehicle adoption creates additional structural demand through silver-intensive components including batteries, charging infrastructure, and electrical systems. Industry forecasts suggest EV-related silver consumption could reach 50-75 million ounces annually by 2028, representing 6-8% of total mine supply.
These industrial demand trends occur against declining silver mine grades and slower exploration activity following years of depressed prices. Primary silver mines averaged 8.2 ounces per ton in 2025, down from 9.7 ounces per ton in 2020, requiring increased processing costs that may limit supply responsiveness to higher prices.
The implications for COMEX operations include potential structural shifts toward higher volatility and more frequent delivery stress periods. Exchange officials have discussed potential contract modifications including reduced contract sizes (2,500 oz vs current 5,000 oz) or alternative delivery locations to improve market functionality.
For investors, persistent low coverage ratios suggest maintaining higher allocations to physical precious metals becomes increasingly important for portfolio protection. Traditional 5-10% allocations may prove insufficient during periods when financial markets lose access to adequate physical supply backing.
Long-term positioning strategies should account for potentially higher price volatility and more frequent supply disruptions. This environment favors patient investors willing to accept short-term volatility in exchange for long-term supply scarcity benefits.
Frequently Asked Questions
What coverage ratio level indicates immediate delivery risk? Coverage ratios below 40% typically trigger immediate delivery stress, while levels between 40-50% create elevated risk conditions. The current 52.6% ratio suggests heightened caution rather than immediate crisis.
How quickly can coverage ratios change during market stress? Historical episodes show coverage ratios can decline 10-15 percentage points within 2-3 weeks during acute stress periods, as seen during March 2020 and October 2008 market disruptions.
Should investors avoid silver futures during low coverage periods? While not necessary to avoid entirely, reducing position sizes and maintaining shorter duration exposures helps limit delivery risk. Physical ownership provides better protection during extended low coverage periods.
Do ETFs face the same delivery risks as futures contracts? Major silver ETFs like SLV maintain their own physical inventory separate from COMEX, though they may face premium/discount volatility during delivery stress periods affecting underlying futures markets.
How do mining stocks perform during coverage ratio squeezes? Mining stocks typically outperform during delivery stress periods, as investors seek indirect exposure to avoid direct delivery complications. However, they also face higher volatility during these episodes.
As we've analyzed throughout our comprehensive guide to COMEX inventory dynamics, the current coverage ratio situation demands careful attention and strategic positioning. For investors seeking to track these critical metrics in real-time, the COMEX Inventory Tracker provides essential data updates to inform positioning decisions during these elevated risk periods.
Sources
- CME Group COMEX Data: https://www.cmegroup.com/markets/metals.html
- CFTC Commitments of Traders Reports: https://www.cftc.gov/dea/futures/other_lf.htm
- LBMA Market Data: https://www.lbma.org.uk/prices-and-data
- World Gold Council Research: https://www.gold.org/goldhub/data
- Silver Institute Supply/Demand Data: https://www.silverinstitute.org
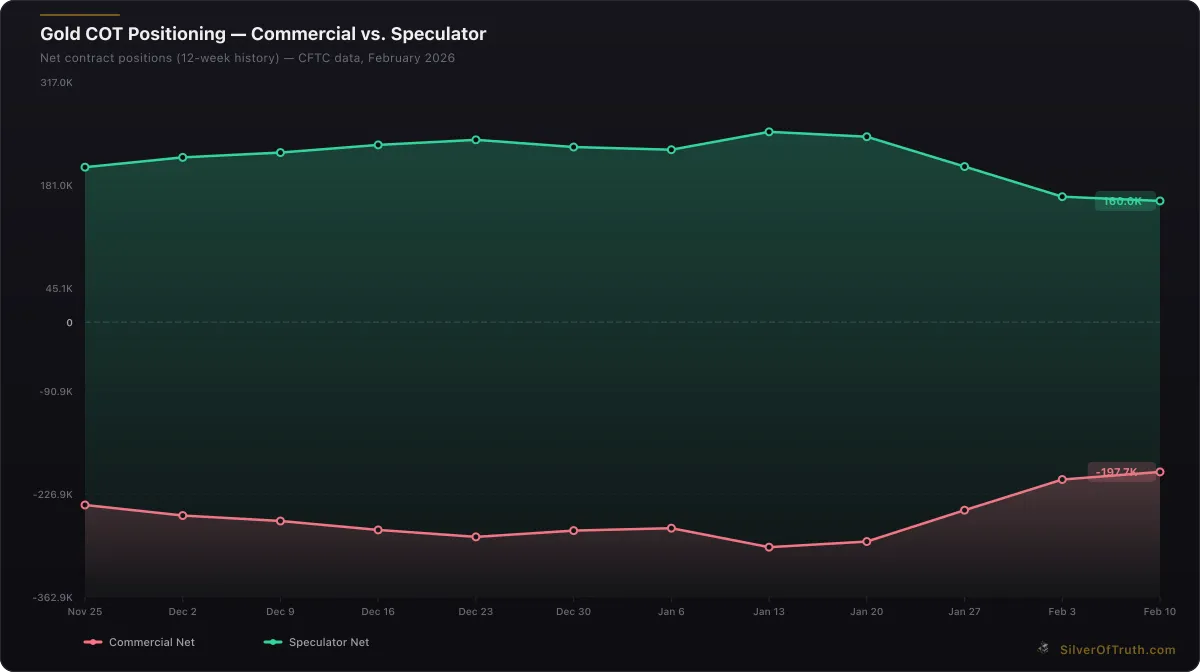
Gold COT positioning: commercial hedgers (red) vs. speculators (green). Source: CFTC via SilverOfTruth, February 2026
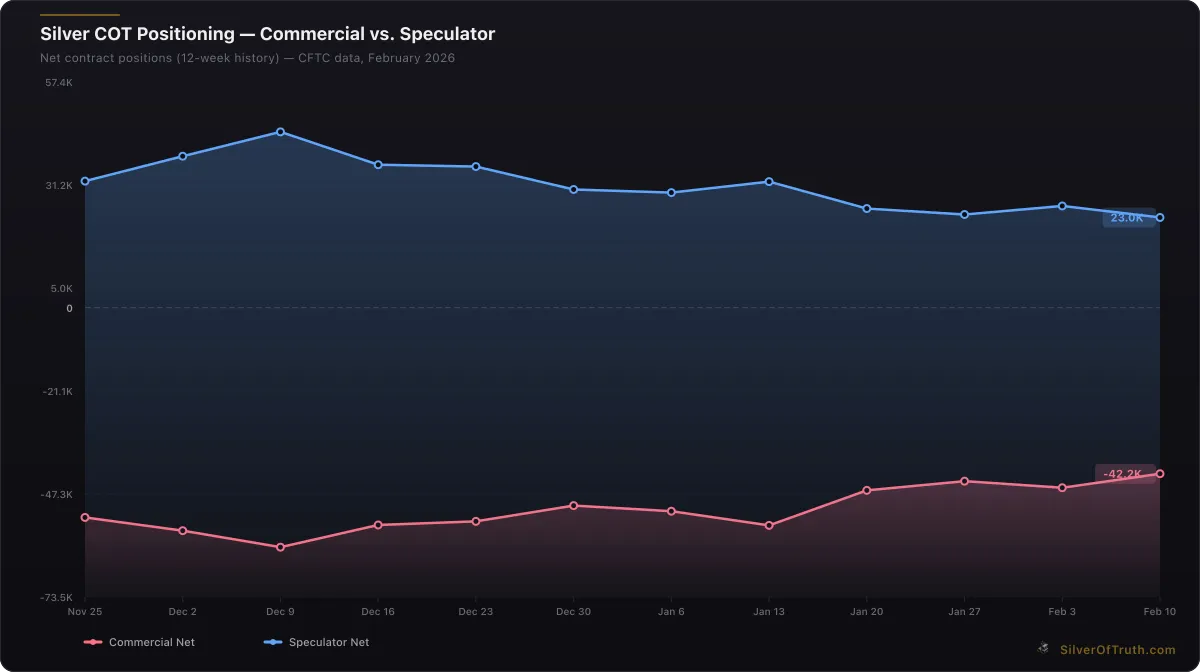
Silver COT positioning: commercial hedgers (red) vs. speculators (blue). Source: CFTC via SilverOfTruth, February 2026
Disclaimer: This article is for informational and educational purposes only and does not constitute financial, investment, or trading advice. Past performance is not indicative of future results. Always conduct your own research and consult with a qualified financial advisor before making investment decisions. SilverOfTruth provides market data and analysis tools — it does not provide personalized financial advice.